Now that you've connected your data sources to Azure Sentinel, you can create custom analytics rules to help you discover threats and anomalous behaviors that are present in your environment. These rules search for specific events or sets of events across your environment, alert you when certain event thresholds or conditions are reached, generate incidents for your SOC to triage and investigate, and respond to threats with automated tracking and remediation processes.
This tutorial helps you create custom rules to detect threats with Azure Sentinel.
Create a custom analytics rule with a scheduled query
-
From the Azure Sentinel navigation menu, select Analytics.
-
In the action bar at the top, select +Create and select Scheduled query rule. This opens the Analytics rule wizard.


Analytics rule wizard - General tab
-
Provide a unique Name and a Description.
-
In the Tactics field, you can choose from among categories of attacks by which to classify the rule. These are based on the tactics of the MITRE ATT&CK framework.
-
Set the alert Severity as appropriate.
-
When you create the rule, its Status is Enabled by default, which means it will run immediately after you finish creating it. If you don’t want it to run immediately, select Disabled, and the rule will be added to your Active rules tab and you can enable it from there when you need it.

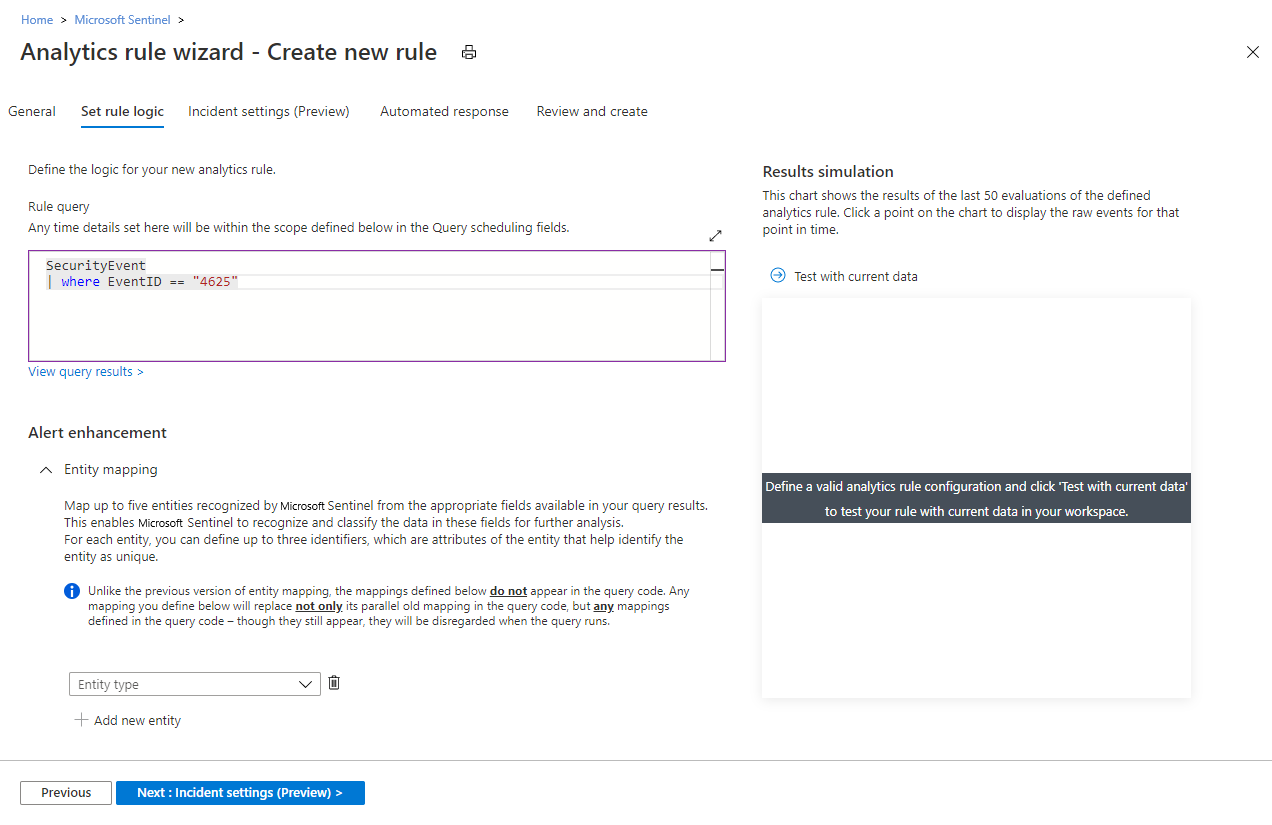
Define the rule query logic and configure settings
In the Set rule logic tab, you can either write a query directly in the Rule query field, or create the query in Log Analytics and then copy and paste it here.
-
Queries are written in Kusto Query Language (KQL). Learn more about KQL concepts and queries, and see this handy quick reference guide.
-
The example shown in this screenshot queries the SecurityEvent table to display a type of failed Windows logon events.
-
Here's another sample query, one that would alert you when an anomalous number of resources is created in Azure Activity.

AzureActivity
| where OperationName == "Create or Update Virtual Machine" or OperationName =="Create Deployment"
| where ActivityStatus == "Succeeded"
| make-series dcount(ResourceId)  default=0 on EventSubmissionTimestamp in range(ago(7d), now(), 1d) by Caller
Note
Rule query best practices
-
The query length should be between 1 and 10,000 characters and cannot contain "
search *" or "union *". You can use user-defined functions to overcome the query length limitation. -
Using ADX functions to create Azure Data Explorer queries inside the Log Analytics query window is not supported.
-
When using the
bag_unpackfunction in a query, if you project the columns as fields using "project field1" and the column doesn't exist, the query will fail. To guard against this happening, you must project the column as follows:project field1 = column_ifexists("field1","")
Alert enrichment
Important
The alert enrichment features are currently in PREVIEW. See the Supplemental Terms of Use for Microsoft Azure Previews for additional legal terms that apply to Azure features that are in beta, preview, or otherwise not yet released into general availability.
-
Use the Entity mapping configuration section to map parameters from your query results to Azure Sentinel-recognized entities. Entities enrich the rules' output (alerts and incidents) with essential information that serves as the building blocks of any investigative processes and remedial actions that follow. They are also the criteria by which you can group alerts together into incidents in the Incident settings tab.
Learn more about entities in Azure Sentinel.
See Map data fields to entities in Azure Sentinel for complete entity mapping instructions, along with important information about backward compatibility.
-
Use the Custom details configuration section to extract event data items from your query and surface them in the alerts produced by this rule, giving you immediate event content visibility in your alerts and incidents.
Learn more about surfacing custom details in alerts, and see the complete instructions.
Query scheduling and alert threshold
-
In the Query scheduling section, set the following parameters:

-
Set Run query every to control how often the query is run - as frequently as every 5 minutes or as infrequently as once every 14 days.
-
Set Lookup data from the last to determine the time period of the data covered by the query - for example, it can query the past 10 minutes of data, or the past 6 hours of data. The maximum is 14 days.
Note
Query intervals and lookback period
These two settings are independent of each other, up to a point. You can run a query at a short interval covering a time period longer than the interval (in effect having overlapping queries), but you cannot run a query at an interval that exceeds the coverage period, otherwise you will have gaps in the overall query coverage.
Ingestion delay
To account for latency that may occur between an event's generation at the source and its ingestion into Azure Sentinel, and to ensure complete coverage without data duplication, Azure Sentinel runs scheduled analytics rules on a five-minute delay from their scheduled time.
For a detailed technical explanation of why this delay is necessary and how it solves this problem, see Ron Marsiano's excellent blog post on the subject, "Handling ingestion delay in Azure Sentinel scheduled alert rules".
-
-
Use the Alert threshold section to define the sensitivity level of the rule. For example, set Generate alert when number of query results to Is greater than and enter the number 1000 if you want the rule to generate an alert only if the query returns more than 1000 results each time it runs. This is a required field, so if you don’t want to set a threshold – that is, if you want your alert to register every event – enter 0 in the number field.
Results simulation
In the Results simulation area, in the right side of the wizard, select Test with current data and Azure Sentinel will show you a graph of the results (log events) the query would have generated over the last 50 times it would have run, according to the currently defined schedule. If you modify the query, select Test with current data again to update the graph. The graph shows the number of results over the defined time period, which is determined by the settings in the Query scheduling section.
Here's what the results simulation might look like for the query in the screenshot above. The left side is the default view, and the right side is what you see when you hover over a point in time on the graph.

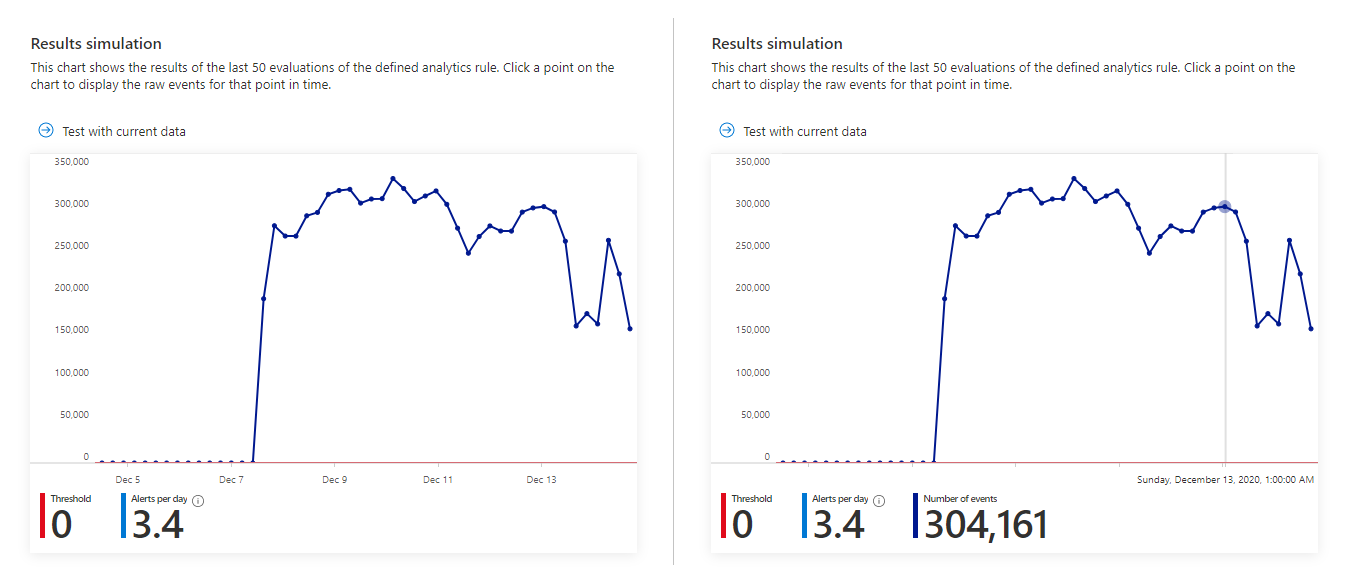
If you see that your query would trigger too many or too frequent alerts, you can experiment with the settings in the Query scheduling and Alert threshold sections and select Test with current data again.
Event grouping and rule suppression
Important
Event grouping is currently in PREVIEW. See the Supplemental Terms of Use for Microsoft Azure Previews for additional legal terms that apply to Azure features that are in beta, preview, or otherwise not yet released into general availability.
Under Event grouping, choose one of two ways to handle the grouping of events into alerts:
-
Group all events into a single alert (the default setting). The rule generates a single alert every time it runs, as long as the query returns more results than the specified alert threshold above. The alert includes a summary of all the events returned in the results.
-
Trigger an alert for each event. The rule generates a unique alert for each event returned by the query. This is useful if you want events to be displayed individually, or if you want to group them by certain parameters - by user, hostname, or something else. You can define these parameters in the query.
Currently the number of alerts a rule can generate is capped at 20. If in a particular rule, Event grouping is set to Trigger an alert for each event, and the rule's query returns more than 20 events, each of the first 19 events will generate a unique alert, and the 20th alert will summarize the entire set of returned events. In other words, the 20th alert is what would have been generated under the Group all events into a single alert option.
-
In the Suppression section, you can turn the Stop running query after alert is generated setting On if, once you get an alert, you want to suspend the operation of this rule for a period of time exceeding the query interval. If you turn this on, you must set Stop running query for to the amount of time the query should stop running, up to 24 hours.
Note
What's the difference between events and alerts?
-
An event is a description of a single occurrence of an action. For example, a single entry in a log file could count as an event. In this context an event refers to a single result returned by a query in an analytics rule.
-
An alert is a collection of events that, taken together, are significant from a security standpoint. An alert could contain a single event if the event had significant security implications - an administrative login from a foreign country outside of office hours, for example.
-
By the way, what are incidents? Azure Sentinel's internal logic creates incidents from alerts or groups of alerts. The incidents queue is the focal point of SOC analysts' work - triage, investigation and remediation.
Azure Sentinel ingests raw events from some data sources, and already-processed alerts from others. It is important to note which one you're dealing with at any time.
-
-
Configure the incident creation settings
In the Incident Settings tab, you can choose whether and how Azure Sentinel turns alerts into actionable incidents. If this tab is left alone, Azure Sentinel will create a single, separate incident from each and every alert. You can choose to have no incidents created, or to group several alerts into a single incident, by changing the settings in this tab.
Important
The incident settings tab is currently in PREVIEW. See the Supplemental Terms of Use for Microsoft Azure Previews for additional legal terms that apply to Azure features that are in beta, preview, or otherwise not yet released into general availability.
For example:

Incident settings
In the Incident settings section, Create incidents from alerts triggered by this analytics rule is set by default to Enabled, meaning that Azure Sentinel will create a single, separate incident from each and every alert triggered by the rule.
-
If you don’t want this rule to result in the creation of any incidents (for example, if this rule is just to collect information for subsequent analysis), set this to Disabled.
-
If you want a single incident to be created from a group of alerts, instead of one for every single alert, see the next section.
Alert grouping
In the Alert grouping section, if you want a single incident to be generated from a group of up to 150 similar or recurring alerts (see note), set Group related alerts, triggered by this analytics rule, into incidents to Enabled, and set the following parameters.
-
Limit the group to alerts created within the selected time frame: Determine the time frame within which the similar or recurring alerts will be grouped together. All of the corresponding alerts within this time frame will collectively generate an incident or a set of incidents (depending on the grouping settings below). Alerts outside this time frame will generate a separate incident or set of incidents.
-
Group alerts triggered by this analytics rule into a single incident by: Choose the basis on which alerts will be grouped together:
TABLE 1 Option Description Group alerts into a single incident if all the entities match Alerts are grouped together if they share identical values for each of the mapped entities (defined in the Set rule logic tab above). This is the recommended setting. Group all alerts triggered by this rule into a single incident All the alerts generated by this rule are grouped together even if they share no identical values. Group alerts into a single incident if the selected entities match Alerts are grouped together if they share identical values for some of the mapped entities, which you can select from the drop-down list).
You might want to use this setting if, for example, you want to create separate incidents based on the source or target IP addresses, or if you want to group alerts that match a specific entity and severity.
Note: When you select this option, you must have at least one entity type or field selected for the rule. Otherwise, the rule validation will fail and the the rule won't be created. -
Re-open closed matching incidents: If an incident has been resolved and closed, and later on another alert is generated that should belong to that incident, set this setting to Enabled if you want the closed incident re-opened, and leave as Disabled if you want the alert to create a new incident.
-
Note
Up to 150 alerts can be grouped into a single incident. If more than 150 alerts are generated by a rule that groups them into a single incident, a new incident will be generated with the same incident details as the original, and the excess alerts will be grouped into the new incident.
Set automated responses and create the rule
-
In the Automated responses tab, select any playbooks you want to run automatically when an alert is generated by the custom rule. For more information on creating and automating playbooks, see Respond to threats.

-
Select Review and create to review all the settings for your new alert rule. When the "Validation passed" message appears, select Create to initialize your alert rule.

View the rule and its output
-
You can find your newly created custom rule (of type "Scheduled") in the table under the Active rules tab on the main Analytics screen. From this list you can enable, disable, or delete each rule.
-
To view the results of the alert rules you create, go to the Incidents page, where you can triage, investigate incidents, and remediate the threats.
-
You can update the rule query to exclude false positives. For more information, see Handle false positives in Azure Sentinel.
Note
Alerts generated in Azure Sentinel are available through Microsoft Graph Security. For more information, see the Microsoft Graph Security alerts documentation.
Troubleshooting
Issue: No events appear in query results
If event grouping is set to trigger an alert for each event, then in certain scenarios, when viewing the query results at a later time (such as when pivoting back to alerts from an incident), it's possible that no query results will appear. This is because the event's connection to the alert is accomplished by the hashing of the particular event's information, and the inclusion of the hash in the query. If the query results have changed since the alert was generated, the hash will no longer be valid and no results will be displayed.
To see the events, manually remove the line with the hash from the rule's query, and run the query.
Issue: A scheduled rule failed to execute, or appears with AUTO DISABLED added to the name
It's a rare occurrence that a scheduled query rule fails to run, but it can happen. Azure Sentinel classifies failures up front as either transient or permanent, based on the specific type of the failure and the circumstances that led to it.
Transient failure
A transient failure occurs due to a circumstance which is temporary and will soon return to normal, at which point the rule execution will succeed. Some examples of failures that Azure Sentinel classifies as transient are:
- A rule query takes too long to run and times out.
- Connectivity issues between data sources and Log Analytics, or between Log Analytics and Azure Sentinel.
- Any other new and unknown failure is considered transient.
In the event of a transient failure, Azure Sentinel continues trying to execute the rule again after predetermined and ever-increasing intervals, up to a point. After that, the rule will run again only at its next scheduled time. A rule will never be auto-disabled due to a transient failure.
Permanent failure - rule auto-disabled
A permanent failure occurs due to a change in the conditions that allow the rule to run, which without human intervention will not return to their former status. The following are some examples of failures that are classified as permanent:
- The target workspace (on which the rule query operated) has been deleted.
- The target table (on which the rule query operated) has been deleted.
- Azure Sentinel had been removed from the target workspace.
- A function used by the rule query is no longer valid; it has been either modified or removed.
- Permissions to one of the data sources of the rule query were changed.
- One of the data sources of the rule query was deleted or disconnected.
In the event of a predetermined number of consecutive permanent failures, of the same type and on the same rule, Azure Sentinel stops trying to execute the rule, and also takes the following steps:
- Disables the rule.
- Adds the words "AUTO DISABLED" to the beginning of the rule's name.
- Adds the reason for the failure (and the disabling) to the rule's description.
You can easily determine the presence of any auto-disabled rules, by sorting the rule list by name. The auto-disabled rules will be at or near the top of the list.
SOC managers should be sure to check the rule list regularly for the presence of auto-disabled rules.
Microsoft Documentation: https://docs.microsoft.com/en-us/azure/sentinel/tutorial-detect-threats-custom
Comments
0 comments
Article is closed for comments.