Reports
Overview
Morpheus offers 28 different report types which are designed to slice up costing and usage across Clouds, Tenants, and more. Reports can be run on-demand as needed or can be scheduled to run on certain intervals to be viewed at a later time. The list of available report types can be viewed at Operations > Reports.
Report Types
ACCOUNT INVENTORY
Tenant Inventory Summary
CLOUD USAGE
Cloud Usage
Cloud Usage App Summary
Cloud Usage Instance Type Summary
CLOUD COST
Amazon Reservation Coverage
Amazon Reservation Utilization
Amazon Savings Inventory Summary
Amazon Savings Plan Coverage
Amazon Savings Plan Utilization
Application Cost
Cloud Cost
Group Cost
Instance Cost
Invoice Details
Tenant Cost
Time Series Cost
INFRASTRUCTURE INVENTORY
Cloud Inventory Summary
Container Host Inventory Summary
Group Inventory Summary
Guidance
Hypervisor Inventory Summary
Migration Planning
Tenant Resource Allocation
PROVISIONING INVENTORY
Instance Inventory Summary
Software Inventory
Software Inventory By Server
Tag Compliance
Virtual Machine Inventory Summary
Workload Summary
By clicking into a report type, users can see any previous runs and active report schedules. New on-demand runs and new schedules of the selected report type can be created, edited, or deleted from here. The next few sections go into creating, editing, scheduling, viewing, and deleting reports in greater detail.
Viewing Results
A list of all report runs is viewable on the Results tab of the report types list page (Operations > Reports). To view the report itself, click on the hyperlinked report filters. Only reports that are ready for viewing will have an active hyperlink on their filters. In addition to report filters, the run date, report type, creating user, and run status are shown. Click on any of these headers to filter the report list by that column in either ascending or descending order. Any report can be deleted by clicking on the trash can icon at the end of its row.
Viewing Schedules
A list of all scheduled report runs can be viewed in the Scheduled tab of the report types list page (Operations > Reports). The friendly name of the report schedule is displayed along with the report type, last run time, next run time, and success status of the previous run. Schedules can be edited or deleted by clicking on the pencil or trash can icon, respectively. We can also view the most recent run of a given schedule (if it was successful) by clicking on the hyperlinked “last run” value.
Analytics
Overview
The Morpheus Analytics engine gives administrators the tools to break down costs and usage, then filter the results by relevant delineations including Groups, Clouds, Tenants or even tag values. Analytics dashboards can be organized into three primary categories based on their measurement intentions: costing, utilization, and workloads. Each dashboard type is discussed in further detail below.
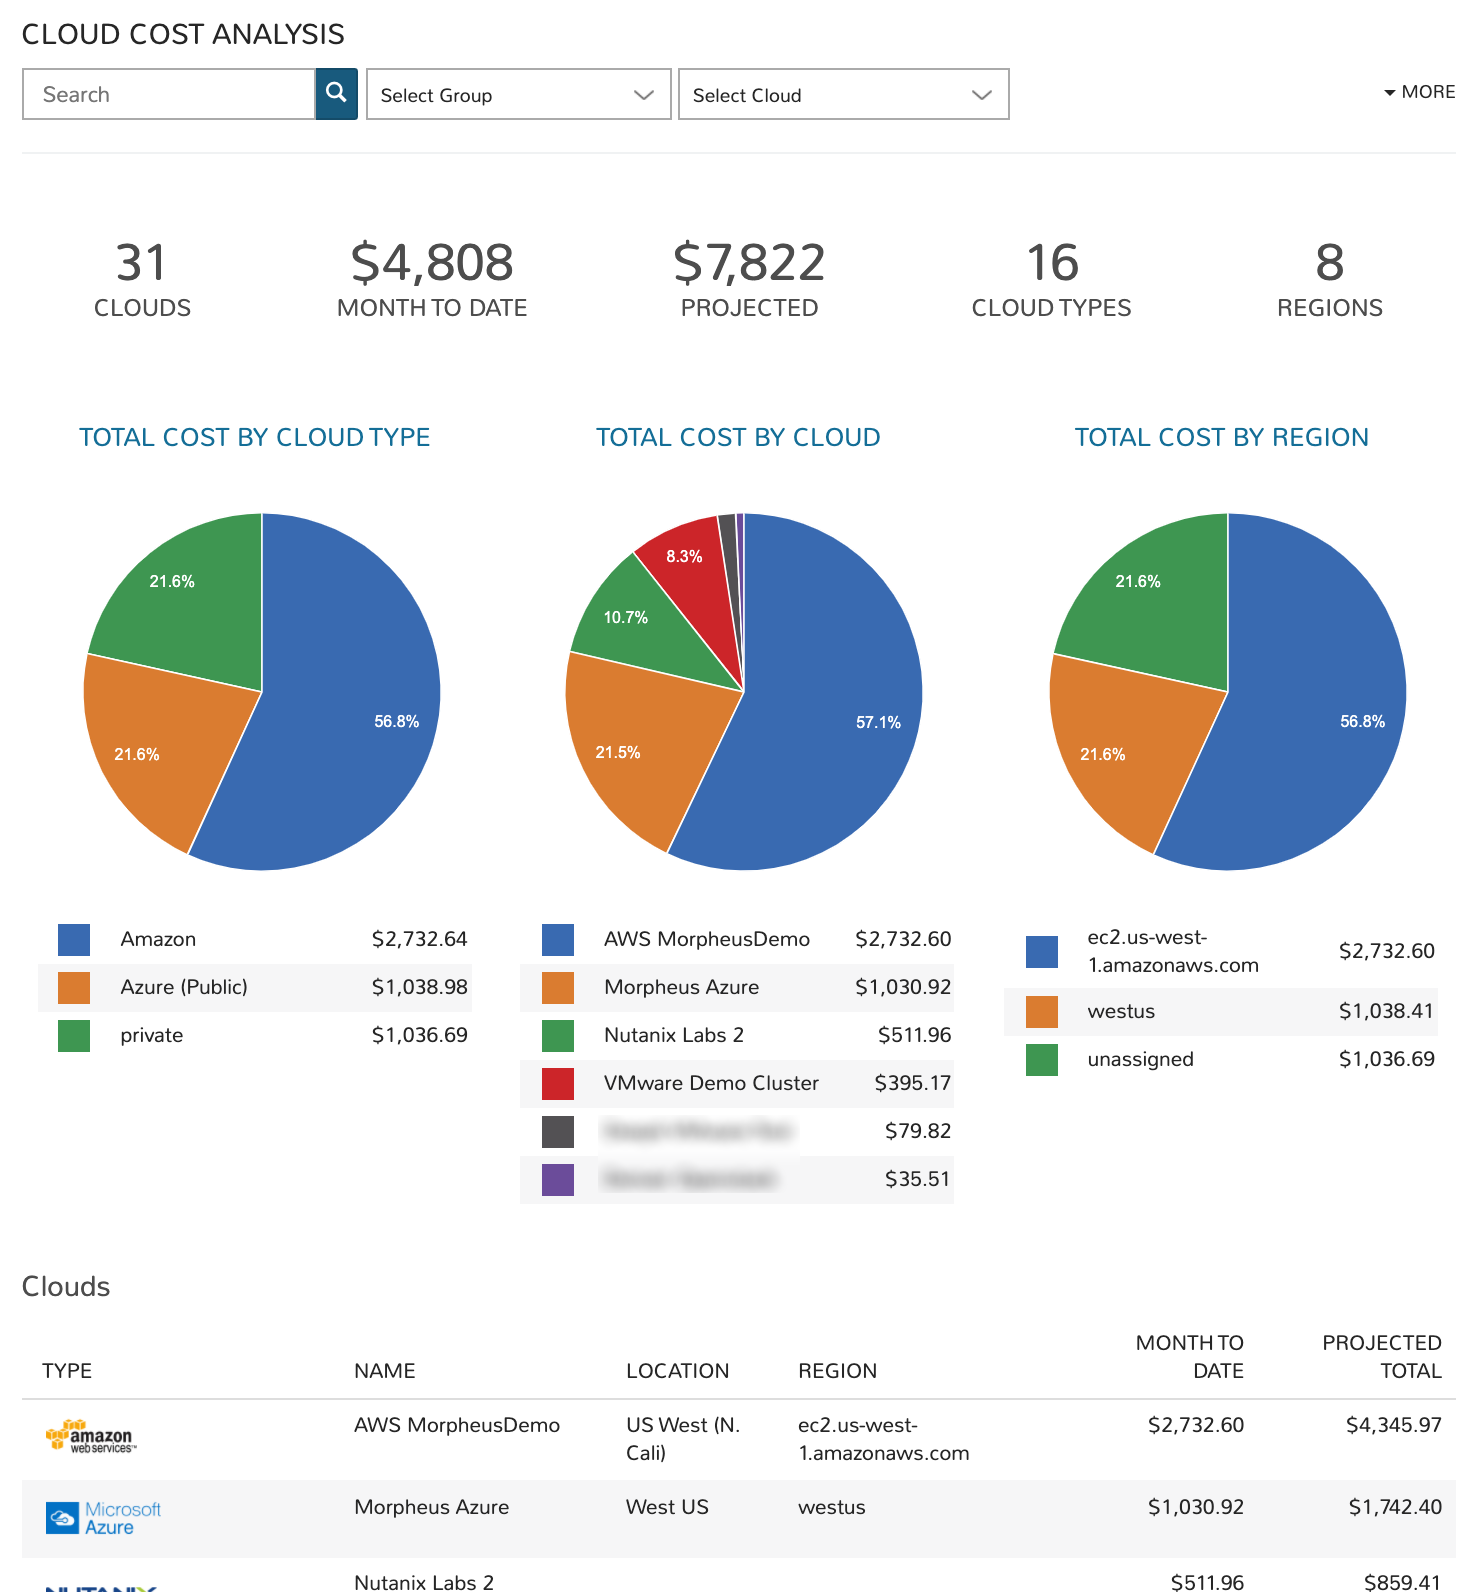
Costing: Cloud Costing
Filters
Filter the Clouds pulled into the dashboard by one or more of the following fields:
-
Cloud (all matched by search)
-
Group
-
Cloud (selected from dropdown)
-
Tenant
-
Tag (Key)
-
Value (tag value)
Data Displayed
The following aggregate totals are compiled for all Clouds that meet set filters:
-
CLOUDS: The total number of Clouds that meet set filters
-
MONTH TO DATE: The total spend in the current month for all Clouds meeting dashboard filters
-
PROJECTED: The projected total spend for the current month for all Clouds meeting dashboard filters
-
CLOUD TYPES: The number of distinct cloud types that meet the dashboard filters, such as Amazon AWS, Microsoft Azure, VMware, or any other Morpheus-supported Cloud types
-
REGIONS: The total number of regions represented by Clouds meeting the dashboard filters
In addition to the totals described above, graphs visualize the percentage of these totals accounted for by specific Clouds, Cloud types, and Cloud regions.
Cloud List
Each Cloud that meets set filters is listed at the bottom of the dashboard, the following data points are revealed for each individual Cloud:
-
TYPE: The Cloud type, such as Amazon AWS, Microsoft Azure, VMware, or any other Morpheus-supported Cloud type
-
NAME: The name given to the Cloud in Morpheus at the time of integration
-
LOCATION: The Cloud location (if available)
-
REGION: The Cloud region (if available)
-
MONTH TO DATE: The current month-to-date spend for the individual Cloud listed
-
PROJECTED TOTAL: The projected total spend for the current month for the individual Cloud listed.
Costing: Group Costing
The Group Costing dashboard aggregates cost totals for all Groups that meet filters set on the dashboard. This allows administrators to sort Groups by their total costs and anticipate monthly total costs by Group.
Filters
Filter the Groups pulled into the dashboard by one or more of the following fields:
-
Group (all matched by search)
-
Group (selected from dropdown)
-
Cloud
-
Tenant
Data Displayed
The following aggregate totals are compiled for all Groups that meet set filters:
-
GROUPS: The total number of Groups that meet set filters
-
MONTH TO DATE: The total spend in the current month for all Groups meeting dashboard filters
-
PROJECTED: The projected total spend for the current month for all Groups meeting dashboard filters
Group List
Each Group that meets set filters is listed at the bottom of the dashboard, the following data points are revealed for each individual Group:
-
NAME: The name given to the Group in Morpheus at the time of creation
-
LOCATION: The Group location (if available)
-
DATACENTER: The Group datacenter (if available)
-
MONTH TO DATE: The current month-to-date spend for the individual Group listed
-
PROJECTED TOTAL: The projected total spend for the current month for the individual Group listed.
Costing: Tenant Costing
The Tenant Costing dashboard aggregates costing totals across all Tenants that meet the filters set on the dashboard. This information helps administrators track the current spend of each Tenant for the current monthly period. It also helps identify the costliest Tenants and to anticipate month-end costs for each individual Tenant.
Filters
Filter the Tenants pulled into the dashboard by one or more of the following fields:
-
Tenant (all matched by search)
-
Cloud
-
Tenant (selected from dropdown)
Data Displayed
The following aggregate totals are compiled for all Tenants that meet set filters:
-
TENANTS: The total number of Tenants that meet set filters
-
MONTH TO DATE: The total spend in the current month for all Tenants meeting dashboard filters
-
PROJECTED: The projected total spend for the current month for all Tenants meeting dashboard filters
-
LAST MONTH: The total spend in the prior month for all Tenants meeting dashboard filters
Tenant List
Each Tenant that meets set filters is listed at the bottom of the dashboard, the following data points are revealed for each individual Tenant:
-
NAME: The name given to the Tenant in Morpheus at the time of creation
-
DESCRIPTION: The Tenant description (if available)
-
MONTH TO DATE: The current month-to-date spend for the individual Tenant listed
-
PROJECTED TOTAL: The projected total spend for the current month for the individual Tenant listed.
Costing: User Costing
The User Costing dashboard allows administrators to analyze costs for a group of Users that meet specific filters. Once the group is selected, total costs by User for the current month and projected totals are displayed. Administrators can identify their costliest Users and anticipate the total cost by User for budgeting purposes.
Filters
Filter the Groups pulled into the dashboard by one or more of the following fields:
-
User (all matched by search)
-
Group
-
Cloud
-
Period (Current month, last three months, last six months, or last 12 months)
-
Tenant
Data Displayed
The following aggregate totals are compiled for all Users that meet set filters:
-
USERS: The total number of Users that meet set filters
-
MONTH TO DATE: The total spend in the current month for all Users meeting dashboard filters
-
PROJECTED: The projected total spend for the current month for all Users meeting dashboard filters
User List
Each User that meets set filters is listed at the bottom of the dashboard, the following data points are revealed for each individual User:
-
USERNAME: The username given to the User in Morpheus at the time of creation
-
MONTH TO DATE: The current month-to-date spend for the individual User listed
-
PROJECTED TOTAL: The projected total spend for the current month for the individual User listed.
Costing: Workload Costing
The Workload Costing dashboard allows administrators to look at all or a subset of Morpheus-managed workloads to analyze their cost impact. Filters can be set to isolate a specific group of workloads and cost breakdowns are shown. Graphs are generated to reveal cost breakdowns of individual workloads or certain groups of workloads.
Filters
Filter the workloads pulled into the dashboard by one or more of the following fields:
-
Workload name (all matched by search)
-
Group
-
Cloud
-
Tenant
-
Tag (Key). This is a required field and the top key in the list will be pre-selected by default
-
Value (tag value)
Data Displayed
The following aggregate totals are compiled for all workloads that meet set filters:
-
WORKLOADS: The total number of workloads that meet set filters
-
MONTH TO DATE: The total spend in the current month for all workloads meeting dashboard filters
-
PROJECTED: The projected total spend for the current month for all workloads meeting dashboard filters
-
TYPES: The total number of workload types represented among workloads meeting set filters
-
SIZES: The total number of unique workload sizes represented among workloads meeting set filters.
Costing: Budget Analysis
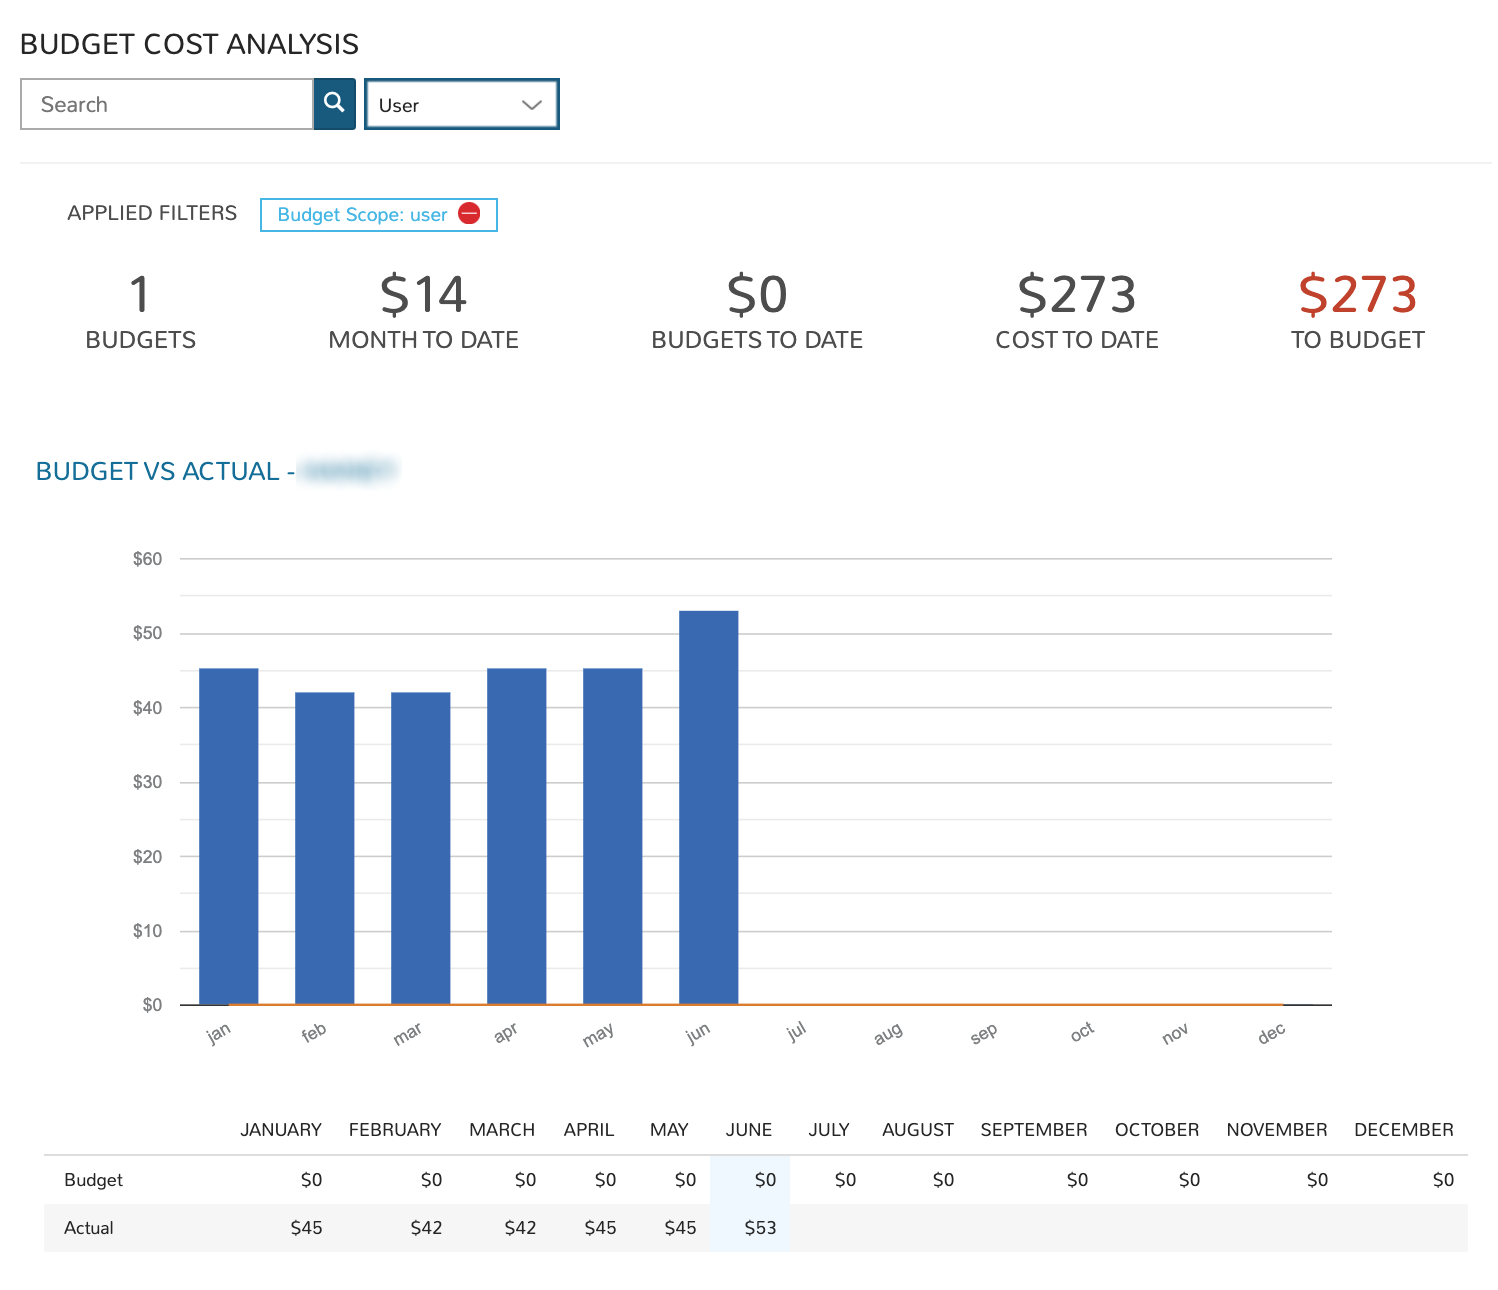
The Budget Analysis dashboard allows administrators to filter and view budgets in one place in order to keep track of progress against budget over time. Budgets in Morpheus (Operations > Budgets) are tied to a specific scope (Account, Tenant, Cloud, Group, or User) and budgets of the same scope are viewed together in this dashboard. A scope filter must be set in order for data to be populated into the dashboard. Once a scope is selected, the search bar can be utilized to return only budgets within the selected scope whose “Name” meets the search terms.
Filters
Filter the budgets pulled into the dashboard by one or more of the following fields:
-
Budget name (all matched by search)
-
Scope (This is a required field, data is not populated into the dashboard until a scope is specified)
Data Displayed
The following aggregate totals are compiled for all budgets that meet set filters:
-
BUDGETS: The total number of budgets that meet set filters
-
MONTH TO DATE: The total spend in the current month against the selected budgets
-
BUDGETS TO DATE: The total amount budgeted to date among budgets selected by the dashboard filters (from the start of the year to the end of the current interval)
-
TO BUDGET: The difference between the COST TO DATE and BUDGETS TO DATE value, should be close to $0 if the costs are appropriately tracking against the budgeted amounts
Budget List
Each budget with its own graph and breakdown is displayed going down the page. The format of the information presented depends on the interval that the specific budget is configured for.
Costing: Tag Costing
The Tag Analysis dashboard creates groups of workloads based on the presence of specific tags and meeting other filters. This workload group can be analyzed for total cost and projected costs.
Filters
Filter the workloads pulled into the dashboard by one or more of the following fields:
-
Tag key (all matched by search)
-
Metric (apply to see the top tag values by workload count, price, memory, storage, or CPU cores)
-
Group
-
Cloud
-
Tenant
-
Tag (Key)
Data Displayed
The following aggregate totals (by tag) are compiled for workloads that meet set filters:
-
TAGS: The total number of unique tag keys for workloads meeting dashboard filters
-
MONTH TO DATE: The total spend in the current month for selected workloads
-
PROJECTED: The total projected current-month spend for selected workloads
Tags List
A list of each tag (key) represented on selected workloads is displayed in a list below the dashboard graphs. We also see the total number of workloads associated with the tag, the total memory, total storage, total CPU cores, and total price. If we click the “MORE” link at the end of each row, we can see a list of all tag values associated with the key.
Utilization: Utilization vs Cost
The Utilization vs Cost dashboard is designed to reveal workloads which are underutilized (expensive and seldom-used) and which are very cost-efficient (inexpensive and frequently-used). Administrators can filter the workloads considered by the dashboard through the use of filters and potentially identify areas of cost savings by decommissioning seldom-used machines.
Filters
Filter the workloads pulled into the dashboard by one or more of the following fields:
-
Workload name (all matching search terms)
-
Time period (Current, one-day average, one-week average, one-month average, three-month average, six-month average, or one-year average)
-
Type (virtual machines, hosts, or bare metal)
-
Tenant
-
Tag (Key)
-
Value (Tag value)
Data Displayed
The following aggregate totals are compiled for workloads that meet set filters:
-
COUNT: The total number of workloads that meet dashboard filters
-
CLOUD COUNT: The total number of Clouds represented by the selected workloads
-
MONTH TO DATE: The total spend in the current month for selected workloads
-
PROJECTED: The total projected current-month spend for selected workloads
-
AVERAGE UTILIZATION: The computed average utilization figure for all workloads selected by dashboard filters
Utilization List
In addition to the totals and graph displayed, two workload lists are given showing the least utilized workloads by cost (lowest utilization per cost dollar) and the least utilized workloads overall (lowest utilization overall). These workloads are listed with links to the Instance or server detail pages, along with other details related to price and resource utilization.
Workloads: Instance Type Usage
The Instance Type Usage dashboard organizes workloads meeting dashboard filters by their Instance type. In additional to counts, administrators can view resource consumption and cost figures by Instance type groupings as well.
Filters
Filter the workloads pulled into the dashboard by one or more of the following fields:
-
Instance type name (all matching search terms, Morpheus-default Instance types are not included when using the search filter)
-
Metric (apply to see the top Instance types by workload count, price, memory, storage, or CPU cores)
-
Group
-
Cloud
-
Tenant
-
Tag (Key)
-
Value (Tag value)
Data Displayed
The following aggregate totals are compiled for workloads that meet set filters:
-
TYPES: The total number of Instance types represented among workloads meeting the dashboard filters
-
INSTANCES: The total number of Instances represented in the data
-
MONTH TO DATE: The total spend in the current month for selected workloads
-
PROJECTED: The total projected current-month spend for selected workloads
-
MEMORY: The total memory allotted to selected workloads
-
STORAGE: The total storage allotted to selected workloads
Instance Type Usage List
Each Instance type represented in the dashboard is listed below the graph. For each Instance type shown, we see the number of Groups the Instance type is represented in, the number of Clouds the Instance type has been provisioned into, and the total amount of memory allotted to workloads of each Instance type.
Workloads: Instance Usage
The Instance Usage dashboard shows Instance counts, resource utilization, and cost breakdowns by Cloud. Administrators can set filters to limit the workloads that are considered for dashboard analysis and then see the results given by Cloud groupings.
Filters
Filter the workloads pulled into the dashboard by one or more of the following fields:
-
Instance name (all matching search terms)
-
Metric (apply to see the top Clouds by workload count, price, memory, storage, or CPU cores)
-
Group
-
Cloud
-
Tenant
-
Tag (Key)
-
Value (Tag value)
Data Displayed
The following aggregate totals are compiled for workloads that meet set filters:
-
CLOUDS: The total number of Clouds represented among workloads meeting the dashboard filters
-
INSTANCES: The total number of Instances represented in the data
-
MONTH TO DATE: The total spend in the current month for selected workloads
-
PROJECTED: The total projected current-month spend for selected workloads
-
MEMORY: The total memory allotted to selected workloads
-
STORAGE: The total storage allotted to selected workloads
Instance Usage List
All Clouds represented in the dashboard are listed here. For each Cloud, we see the total Instance count, total memory allotted, total storage allotted, total CPU cores, and the total price.
Workloads: Blueprint Usage
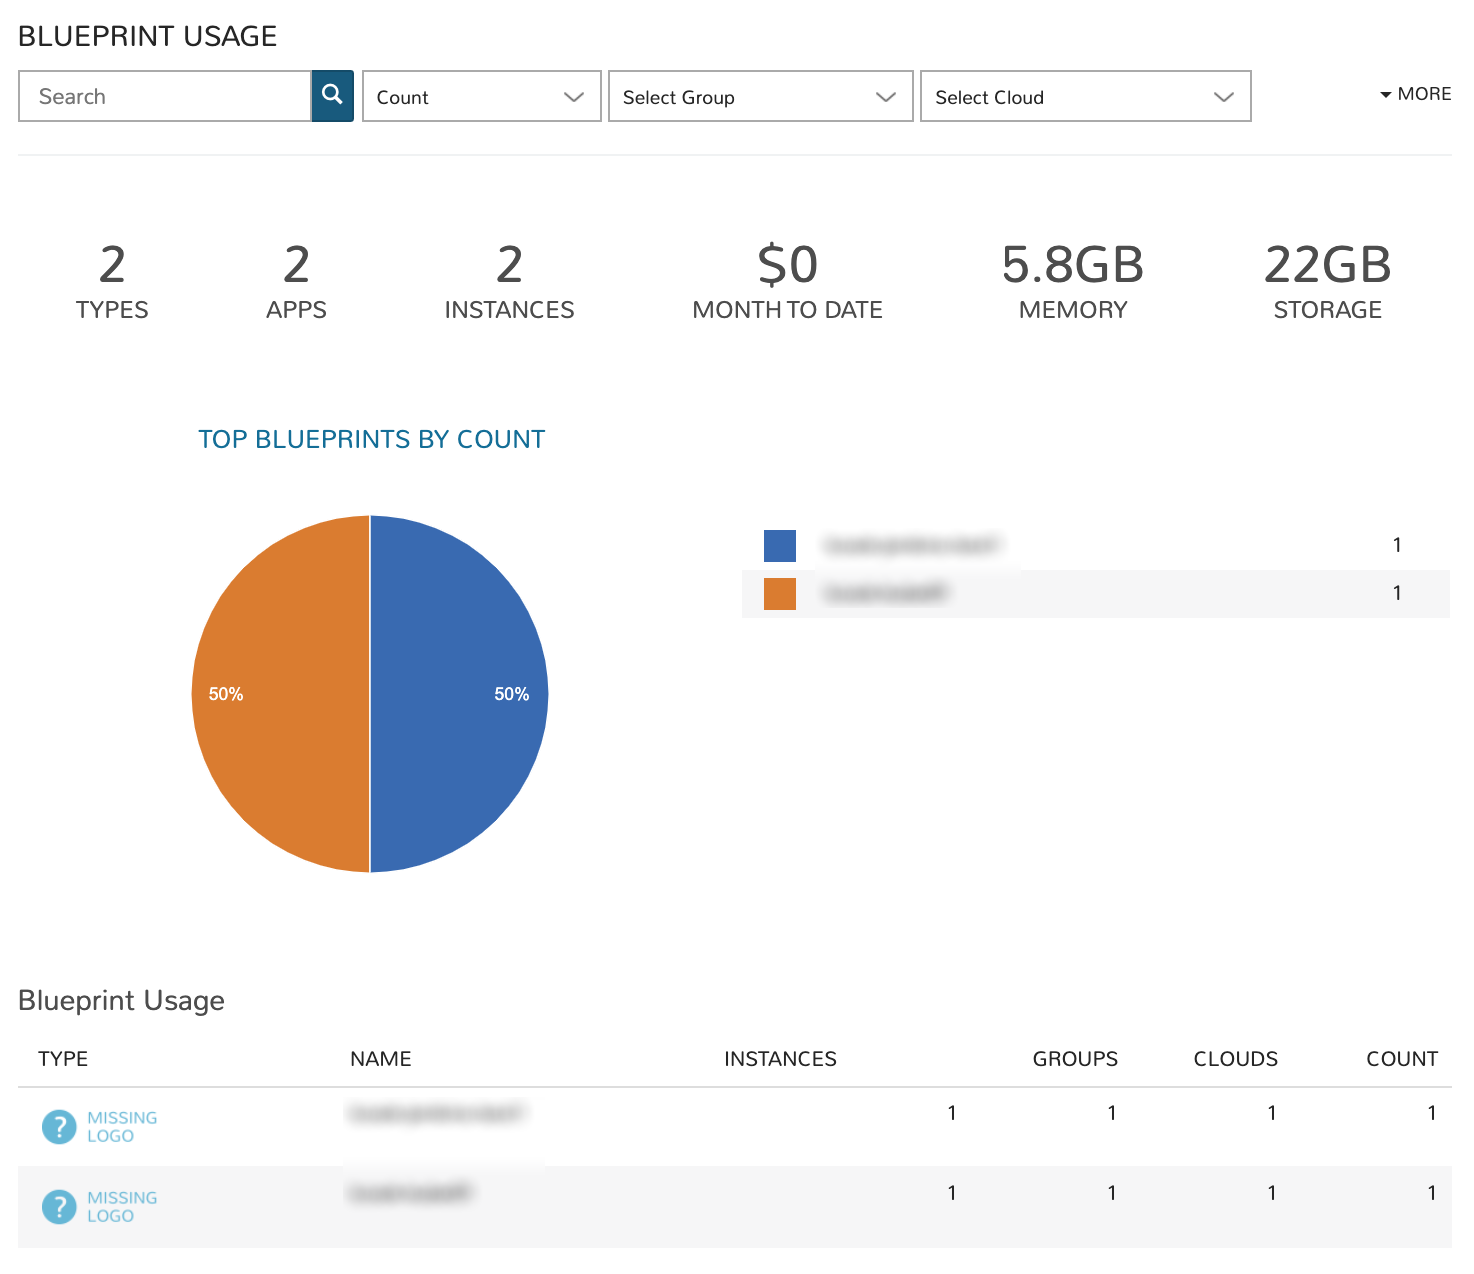
The Blueprint Usage dashboard lists all provisioned Apps that meet filters set on the dashboard. Once the desired group of Apps is filtered into the dashboard, administrators will see the total provisioned from each Blueprint, total number of Instances created from the Apps, and costing details.
Filters
Filter the Apps pulled into the dashboard by one or more of the following fields:
-
App name (all matching search terms)
-
Metric (apply to see the top Clouds by workload count, price, memory, storage, or CPU cores)
-
Group
-
Cloud
-
Tenant
-
Tag (Key)
-
Value (Tag value)
Data Displayed
The following aggregate totals are compiled for Apps that meet set filters:
-
TYPES: The total number of App types represented among Apps meeting the dashboard filters
-
APPS: The total number of Apps represented in the dashboard
-
INSTANCES: The total number of Instances contained in all Apps meeting dashboard filters
-
MONTH TO DATE: The total month-to-date spend for all Apps shown in the dashboard
-
MEMORY: The total memory allotted to selected Apps
-
STORAGE: The total storage allotted to selected Apps
Blueprint Usage List
All Blueprints which have a currently-existing App provisioned from them and selected in the dashboard filters are listed here. The name and type of the Blueprint is listed along with the total number of Instances across all provisionings, total Groups, total Clouds, and the total count of all Apps from that Blueprint.
Workloads: Apps Usage
The Apps Usage dashboard lists all provisioned Apps that meet a set of filters and organizes them by Cloud. Totals for cost and resource usage of all relevant Apps can be viewed with a per-Cloud breakdown.
Filters
Filter the Apps pulled into the dashboard by one or more of the following fields:
-
App name (all matching search terms)
-
Metric (apply to see the top Clouds by workload count, price, memory, storage, or CPU cores)
-
Group
-
Cloud
-
Tenant
-
Tag (Key)
-
Value (Tag value)
Data Displayed
The following aggregate totals are compiled for Apps that meet set filters:
-
CLOUDS: The total number of Clouds represented among Apps meeting the dashboard filters
-
APPS: The total number of Apps represented in the dashboard
-
INSTANCES: The total number of Instances contained in all Apps meeting dashboard filters
-
TOTAL COST: The total cost of all selected Apps
-
MEMORY: The total memory allotted to selected Apps
-
STORAGE: The total storage allotted to selected Apps
Instance Usage List
All Clouds with a currently-provisioned App which is selected in the dashboard filters are listed here. The name of the Cloud is listed along with its App count, the total memory, total storage, total CPU cores and price of the Apps provisioned in that Cloud are also listed.
Wiki
The Morpheus Wiki is a tenant-wide, RBAC-controlled, auditable Wiki that allows easy UI, API and CLI access to information, notes, configurations or any other data needed to be referenced or shared with others. Wiki pages can be created directly from the Wiki tab of the detail page for various resource types, including Clouds, Groups, Servers, Instances, Clusters, and Self-Service Persona Catalog Items. Wiki pages created this way are automatically categorized under the appropriate resource type. Additional Wiki pages and custom categories can be created when viewing the whole Wiki at
Operations > Wiki. Here you will also see the complete Wiki, including pages created on various object detail pages which are categorized appropriately.Highlights
-
Main Wiki section is at
Operations > Wiki -
Wiki tabs are on Clouds, Groups, Instances, Hosts, VMs, Bare Metal, and Clusters detail pages
-
Additional Wiki Pages and Categories can be created from
Operations > Wiki -
When a Wiki tab is populated, a Page is automatically added and accessible at
Operations > Wiki -
One Wiki is created per Tenant. There is no multi-tenant access to Wikis
-
The Wiki is accessible from the UI, CLI and API.
-
Wiki access is RBAC-controlled via the Operations: Wiki permission in User and Tenant Roles (None, Read and Full)
-
Page updates are stamped with the “Last Updated By” user and the time the edit was made
-
Wiki pages can be searched from
/operations/wikior navigated from/operations/wiki-page/page-index -
All wiki pages are encrypted using AES 256-bit encryption
-
Wiki pages use Flexmark for Markdown. Annotate your Wiki pages with headers, text styling, code blocks, hyperlinks, and more as needed
-
Create a new page with title “Home” to replace the default Wiki landing page that ships with Morpheus.
Creating Wikis
The Wiki service ties into assets throughout the environment. Create pages for Instances, hosts, groups, Clouds, and even clusters directly on their detail pages (see the Wiki tab). Users may also just create general notes pages in the centralized Wiki section (Operations > Wiki)in Markdown format.
Creating your first page is as simple as clicking the CREATE PAGE button from the Wiki home page (Operations > Wiki). Write down some content, give the page a title, and click SAVE. The Wiki will also keep track of who last edited a page and when. The beauty of this Wiki is that it’s clean and easy to write down notes related to various parts of your application deployment or infrastructure without going to an external tool. Many Morpheus constructs, such as Instances, hosts, and more, also have their own Wiki page. Navigate to the detail page for the selected construct, open the Wiki tab, and click EDIT to add content.
Hosting Images
It’s possible to add images to your Wiki pages and images can be sourced from the Internet, a Cloud storage bucket (like an AWS S3 Bucket), or even from files stored to the Morpheus appliance’s local file system. Within your Wiki page markdown, add your image using the following syntax:

The text within the square brackets [] sets the HTML “alt” description for the image and the URL within parentheses () is the “src” URL for the image. The Morpheus Archives feature is a great resource for hosting images for use in Wiki. Archives can target cloud storage buckets or even file shares on the Morpheus appliance local storage. Morpheus generates an access URL for each file stored in Archives, simply target this URL in your markdown to show an image stored in Morpheus Archives within your Wiki pages.
Approvals
Morpheus and Service Now Approvals
Overview
Policies can be created for Groups and Clouds to require approvals for actions with the built-in Morpheus approvals engine, or via a ServiceNow integration. Approvals can be configured for Provisioning and Lifecycle extensions.
Configuring Approvals
Configuring Morpheus for Approvals
To configure Morpheus for approvals:
-
Configure Roles for Approval access
-
Optionally configure a ServiceNow Integration for ServiceNow approvals.
-
Please note ServiceNow integration is not required for Internal Approvals.
-
-
Create approvals policies for:
-
Internal Approvals
-
SNOW Approvals
-
Configure Roles
Configure User Role access settings in Administration > Roles > (Role) > Operations: Approvals.
-
All Users with a Role applied containing Operations: Approvals set to Full will have approval authority, and be able to Approve, Deny or Cancel approval requests.
-
All Users with a Role applied that has Operations: Approvals set to Read will be able to view Approval requests and history, but will not be able to Approve, Deny or Cancel approval requests.
-
All Users with a Role applied that has Operations: Approvals set to None will not have access to the Operations: Approvals section, and such will not be able to see or act on approval requests.
-
Regardless of Role settings, any instance or app provisioned by any user to a group or cloud with an active Approval policy applied will require approval before the instance or app will provision.
ServiceNow Approvals
Configure ServiceNow integration for SNOW Approvals
-
Navigate to Admin > Integrations
-
Select + NEW INTEGRATION
-
Select ServiceNow from the Type dropdown in the Integration modal and enter:
-
- Name
-
Name of the integration in Morpheus
-
- Enabled
-
Leave checked to enable the integration.
-
- Host
-
URL of the ServiceNow host (ex: https://ven0000.service-now.com)
-
- User
-
A User in ServiceNow that is able to access the REST interface and create/update/delete incidents, requests, requested items, item options, catalog items, workflows, etc.
-
- Password
-
Password for User above
-
-
Save Changes
Morpheus then configures the integration with ServiceNow, syncs ServiceNow workflows which are available when creating approvals policies. (This process can take up to 5 minutes depending on the size of the workflow table in ServiceNow.)
Create Approval Policies
-
Policies applied to a Group are created in Infrastructure > Groups > (group) > Policies tab.
-
Policies applied to a Cloud are created in Infrastructure > Clouds > (cloud) > Policies tab.
To create an Approval policy:
-
Navigate to the Policies tab in the Group or Cloud to which the policy will apply.
-
Select + ADD POLICY to open the New Policy wizard
-
Select Provision Approval from the Type dropdown
-
Add an optional description
-
- Leave Enabled selected for this Policy to be active once saved.
-
-
Enabled can be deselected to disable to policy.
-
-
In the config section, select either Internal Approvals or ServiceNow Approvals:
-
- Internal Approvals
-
Approval requests will be managed within Morpheus via the Operations: Approvals section.
-
- ServiceNow Approvals
-
Approval requests will be managed with ServiceNow (SNOW). Please note a ServiceNow integration (Admin: Integrations) must be configured prior to SNOW Approval policy generation.
-
For ServiceNow Approvals, select the appropriate ServiceNow workflow for this policy. Please note the workflows presented are created in ServiceNow and synced with Morpheus .
-
-
-
Add the Morpheus Accounts to which this policy will apply, or leave the Accounts field blank to apply to all accounts.
-
Save
Upon saving, a new policy is created in the Group or Cloud Policies tab.
Managing Approval Requests
Once Instance approval policies are added to a Group or Cloud, any Instance or App provisioned into that Group or Cloud will create an approval request entry in the Operations > Approvals section.
User Role permission Operations: Approvals > FULL is required to manage Approvals.
-
To Approve, Deny, or Cancel an internal approval request, select the request and use the Actions dropdown.
-
To Cancel a ServiceNow Approval request, select the request and use the Actions dropdown. ServiceNow approvals are managed in ServiceNow.
Instances requiring provisioning approval will have a PENDING status until approved.
Each Approval Request will have:
-
Name: A name for the approval in Morpheus
-
Monthly Price (Est.): The estimated monthly price of the Instance to be provisioned
-
Request Type: What is being requested, such as Instance approval
-
External Name: For ServiceNow integrations, the name of the approval in the ServiceNow console
-
Type: Internal or ServiceNow
-
Status
-
Date Created
-
Requested By: The Morpheus user making the request
-
- Actions dropdown (for internal approval requests)
-
-
Approve
-
Deny
-
Cancel
-
-
- Actions dropdown (for ServiceNow requests)
-
-
Cancel
-
-
The Approvals list view can be sorted by NAME, REQUEST TYPE, EXTERNAL NAME, DATE CREATED, and REQUESTED BY
Internal approval requests
To Approve, Deny or Cancel an Internal approval request:
-
Navigate to Operations > Approvals
-
Select the Name of the Approval request
-
Select Actions on the far right of the request
-
Select Approve, Deny, or Cancel from the Actions dropdown
-
Select OK on the confirmation modal
-
When an Internal request is approved, the related instance will begin to provision immediately and the request will show approved.
-
When an Internal request is denied, the related instances status will change to Denied and the request will show Rejected in the Approvals section.
-
When an Internal request is canceled, the related related instances status will change to Cancelled and the request will be canceled.
ServiceNow Approval requests
ServiceNow approval request are managed in ServiceNow. The process of approving or rejecting requests is determined by the ServiceNow Workflow selected when configuring the SNOW Approval policy. These Workflows are configured in ServiceNow.
Activity
The Activity section displays a recent activity report for Auditing. Morpheus defines an activity as any major action performed on an instance or server, such as, but not limited to adding a server, deleting a server, provisioning an instance, deleting an instance, creating a backup, etc… This view can be searched and filtered by type, user, and date range.
Activity
There are four types of activities that are displayed in the Activity Reports:
-
Backup
-
Provisioning
-
Alert
-
Permissions
To View a Recent Activity report:
-
Select the
Operationslink in the navigation bar. -
Select
Activityin the sub navigation bar.
Recent activity is displayed in order from recent to oldest. This view can be searched and filtered by type, user, and date range.
Review
To review the item the activity occurred on, click the name of the activity and it will go to a new page and display that item.
Deleted activities are displayed as an alert and do not contain a link to the event item. If the activity is not a deletion event we provide a link on the activity name to go to the item the activity occurred on. Delete activity alerts are shown for Instances, servers, Clouds, Groups, and Monitoring Checks.
To Filter:
-
Click the filter drop down of type of filter you want to apply.
-
Select the appropriate filter.
Alarms
The ALARMS section shows Operation notifications from Cloud and other Service Integrations. Cloud and other Service Integration Alarms are not generated by Morpheus but synced and displayed for visibility in Morpheus.
History
The HISTORY section shows Process History from Instances and Apps processes. This is an aggregate view of the
Historytab in Instance and App details pages.Processes can be expanded to view all process steps and process history detail including output and errors.
Access to HISTORY is given by the
Operations:ActivityRole permission.The Logs displayed in
Administration - Health - Morpheus Logsare from/var/log/morpheus/morpheus-ui/current. These logs show all ui activity and are useful for troubleshooting and auditing. -
-
-
-
-
-
Comments
0 comments
Please sign in to leave a comment.